Ultrasound imaging
Seeing inside the body with echoes
Contents
- 1Probe held against the skin
- 2Row of piezoelectric ceramic elements
- 3Layer of coupling gel
- 4Cable to the console
- 5Screen with a fan-shaped grey-scale section
Ultrasound imaging draws a picture of the inside of the body from echoes. A probe pressed on the skin sends short bursts of sound, far above the range of hearing, and listens for the faint echoes that come back from the boundaries between organs and tissues. The time each echo takes gives its depth, its strength gives its brightness. In 1948 George Ludwig, at the US Naval Medical Research Institute, began detecting gallstones in animal tissue by their ultrasonic echoes; two-dimensional images followed in 1952, and today the method is used from pregnancy checks to the heart.
What it is
Ultrasound imaging, also called sonography, shows organs, vessels and a growing fetus on a screen while the patient lies still and awake. A hand-held probe glides over the skin on a film of gel, and the picture changes as the probe moves. Doctors use it to look at the abdomen, the breast, the eye, the heart and blood flow, to follow a pregnancy, and to guide a needle during a biopsy.
The method uses sound instead of X-rays. Since it sends no ionizing radiation through the body, it is the usual choice during pregnancy.
How it works
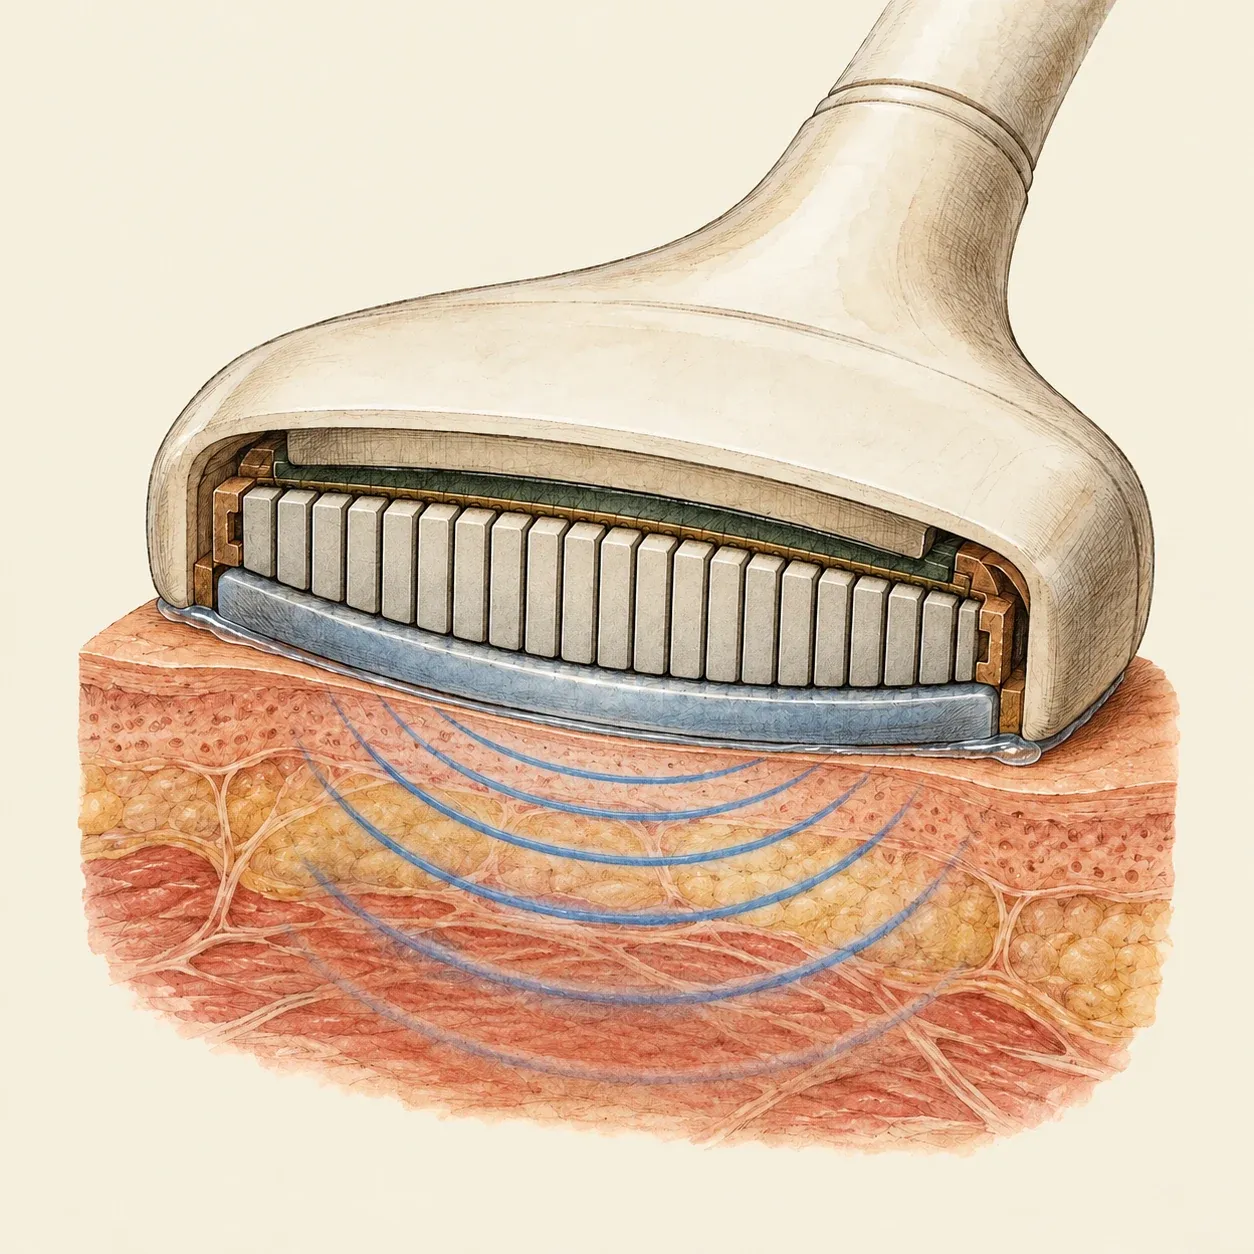 The probe’s ceramic elements both send the sound and hear its echoes.
The probe holds a row of small plates of piezoelectric ceramic. A brief electric pulse makes each plate vibrate and send a burst of sound, far above the range of hearing. The gel fills the gap between probe and skin so that the sound passes into the body. Each time the sound meets a boundary between two tissues, part of it bounces back. The same plates pick up these echoes and turn them back into electric signals.
Sound travels through soft tissue at about 1,540 m/s. The scanner times each echo: an echo that returns twice as late comes from twice as deep. Its strength sets the brightness of a dot on the screen, and stronger echoes show brighter. Firing line after line across the row of plates builds a slice through the body, the grey fan known as B-mode. Repeated many times a second, the slices make a moving picture of a beating heart or a kicking fetus. A Doppler mode measures the small change of pitch in echoes from moving blood to show its flow. Higher frequencies give a narrower beam and finer detail but reach less deep, since tissue absorbs them more.
How to do it
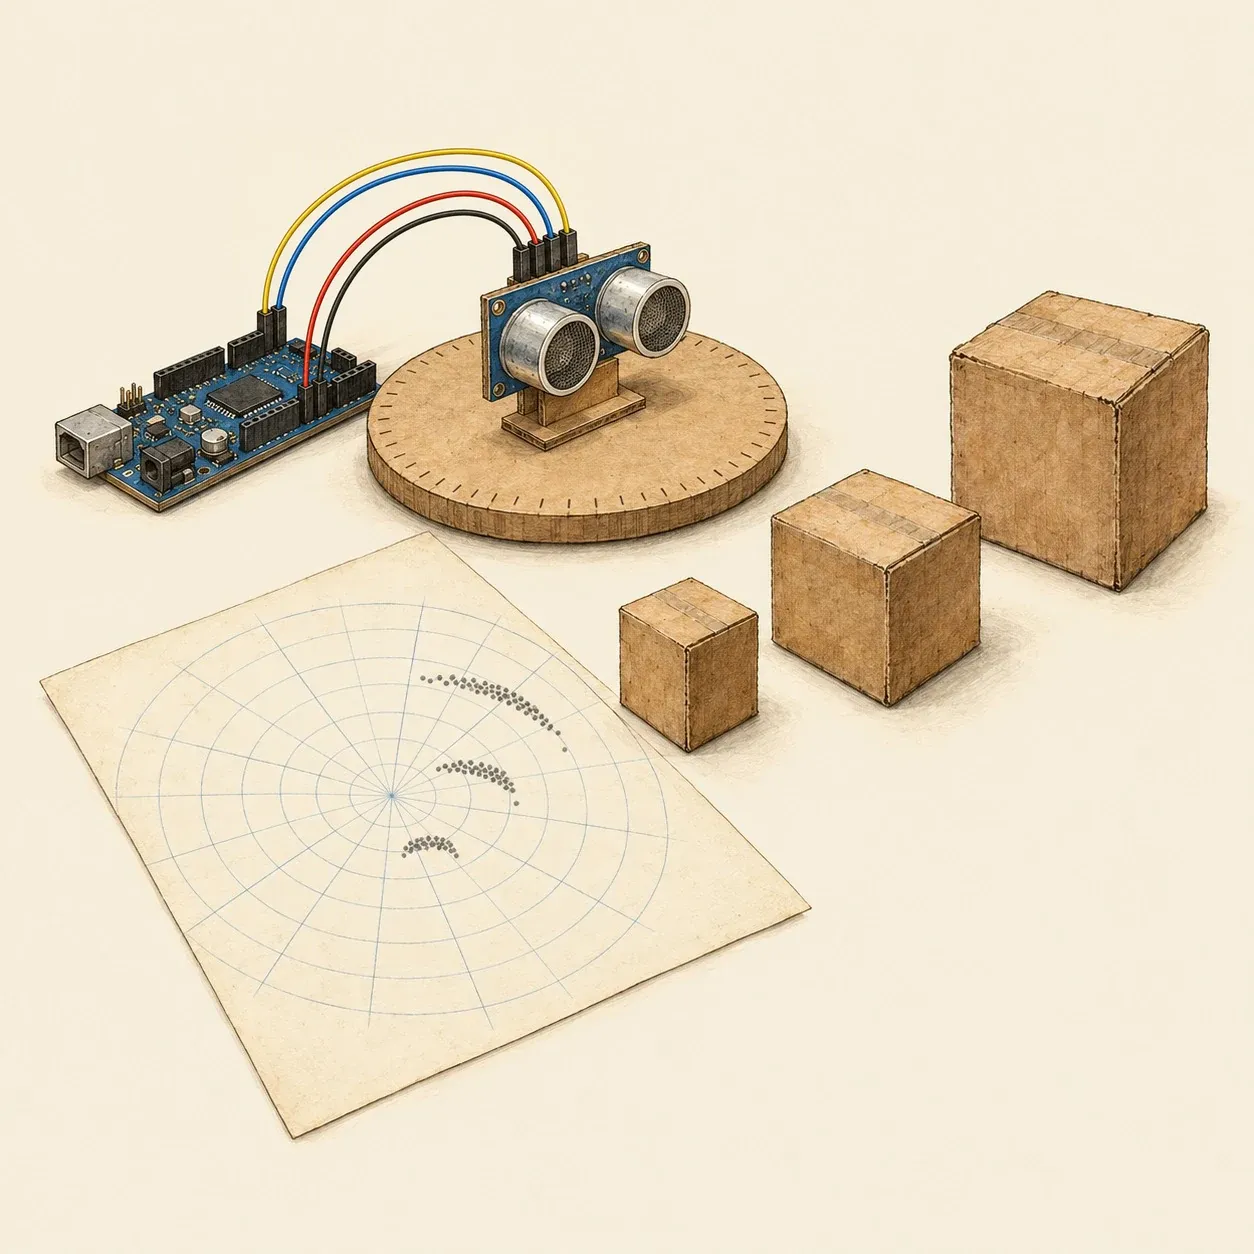 Turned step by step, a sonar range-finder plots the outline of the objects in front of it.
A cheap sonar range-finder shows the echo principle in air. The HC-SR04 module, for example, runs from the 5-volt supply of a microcontroller board such as an Arduino Uno powered over USB.
Connect the module’s VCC pin to 5 V, GND to ground, Trig to a digital pin and Echo to another. In the program, send Trig a short pulse of the length the module’s datasheet gives: the module then sends a burst of ultrasound and holds Echo high until the echo comes back. Measure that time, halve it, since the sound went out and back, and multiply it by the speed of sound in air to get the distance. Leave a pause between measurements so that the last echo has died away.
Glue the module upright on a cardboard disc marked every 10 degrees and set a few boxes on the table in front of it, within the range given in the datasheet. Turn the disc one step at a time from 0 to 180 degrees, note the distance at each angle and plot the points on polar graph paper. The dots trace the fronts of the boxes. The beam spreads as it leaves the module, so edges come out blurred.
History and evolution
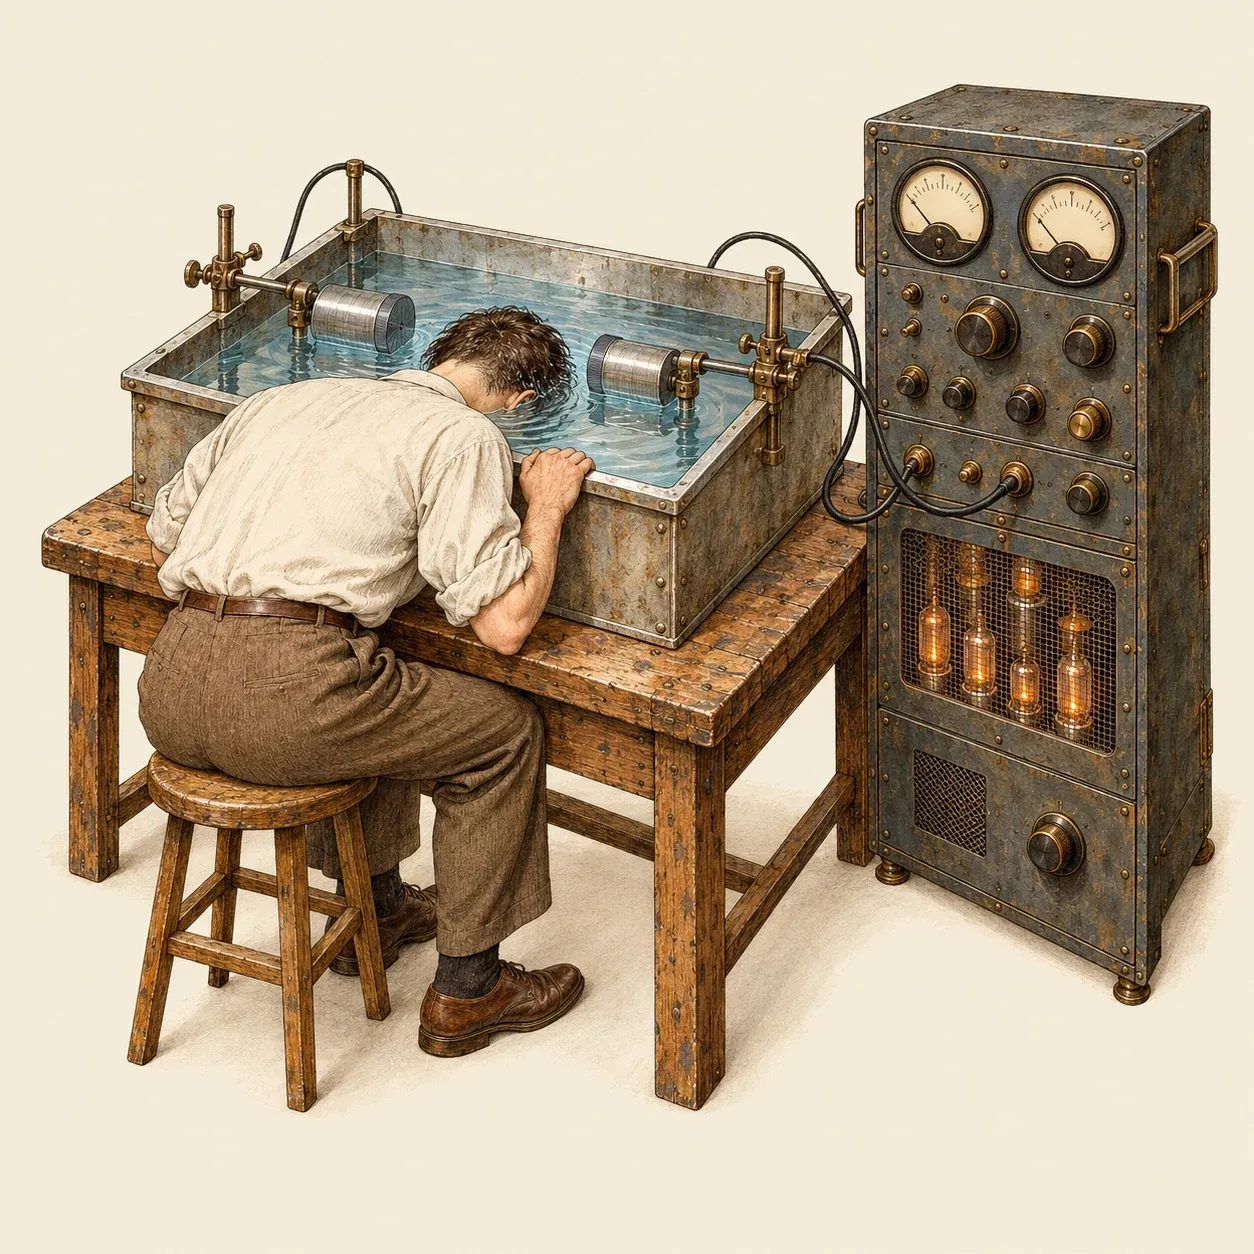 Karl and Friedrich Dussik passed sound through the head from one transducer to the other, with head and transducers under water.
Pierre Curie described the piezoelectric effect in 1880. In 1915 Paul Langevin built an ultrasonic hydrophone to detect submarines, and in 1928 Sergei Sokolov proposed using ultrasound to find flaws in metal. In January 1940 H. Gohr and Th. Wedekind of Cologne suggested in the Klinische Wochenschrift that echoes, as in metal flaw detection, might reveal tumours, effusions or abscesses, but they could not publish convincing results. Karl Dussik, a neurologist in Vienna, began looking at ultrasound for diagnosis around 1937. His 1942 paper on high-frequency mechanical vibrations as a diagnostic aid discussed telling tissues apart by sound passed through them and reported his initial experiments. With his brother Friedrich he built an apparatus that sent a beam of sound through the head from one transducer to another, with the upper head and both transducers in a water bath, and recorded the result as light spots on heat-sensitive paper. In 1947 they produced what they took to be images of the brain’s ventricles, but in 1952 W. Güttner and colleagues at Siemens showed that these patterns were artefacts.
Echoes gave more dependable results. In 1948 George Ludwig, a junior naval officer at the Naval Medical Research Institute in Bethesda, Maryland, began experiments on animal tissue with a transducer made for finding flaws in metal, and detected gallstones by their echoes. He reported the work in June 1949 and later worked with the bioacoustics laboratory at MIT. In 1952 John Wild and his engineer John Reid published two-dimensional echo images, and Douglass Howry in Denver published his own, made with the body part immersed in degassed water. In Glasgow, Ian Donald, John MacVicar and Tom Brown dropped the water tank for a probe in contact with the skin; their 1958 Lancet paper is the start of obstetric ultrasound, and their work led to the Diasonograph scanner.
The Vidoson, developed by Richard Soldner at Siemens in the mid-1960s, showed moving pictures in real time. George Kossoff’s scan converter of the late 1960s brought grey scale, the second ADR linear-array scanner, the model 2130, followed in 1975, and Sam Maslak’s Acuson 128 in 1983.